Guava Schedule/Gantt Chart
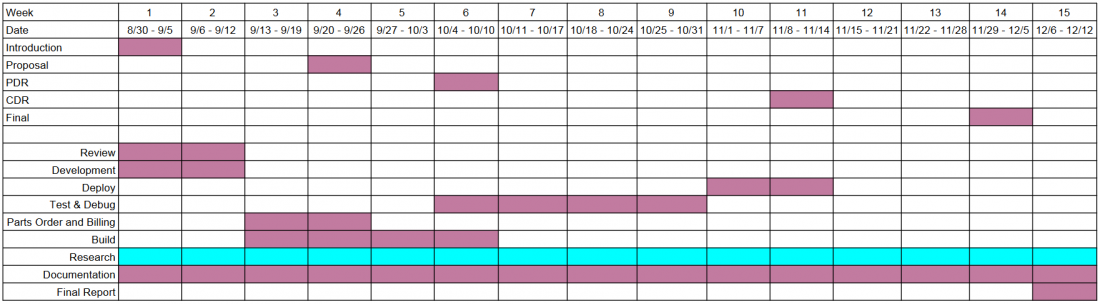
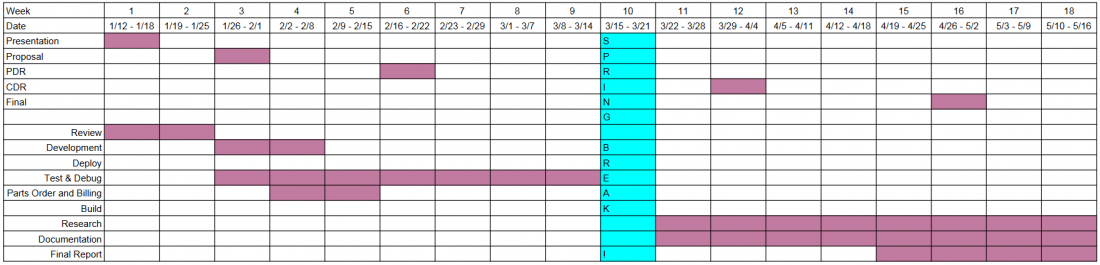
Team Guava creates a Gantt chart every semester to plan the tasks we want to accomplish. This helps track our progress and determine if we are on schedule. The Gantt charts for every semester can be found below.
Fall 2020
Spring 2020
Spring 2018

Fall 2017

Authors
Contributing authors:
Created by dkvilla on 2017/02/14 02:56.