This is an old revision of the document!
Classification is an area of machine learning that determines discrete outputs. Similar to regression, classification models are based off of weights (or coefficients), w0 w1 w2 …, and the machine is trying to find a relationship between the independent variables, x1 x2 x3 …, and the dependent variable(s), typically just y. The difference between regression and classification is that classification problems have discrete outputs, for example the machine needs to predict if a tumor is malignant (yes/no). Another example would be that the machine needs to recognize whether or not a picture is a dog or a cat (dog/cat).
Classification methods discussed in this page:
- Logistic Regression
- K-Nearest Neighbors (K-NN)
- Support Vector Machine (SVM)
- Kernel SVM
- Naive Bayes
- Decision Tree Classification
- Random Forest Classification
Logistic Regression
Previously we used regression to find the best fit line for our data so that we can predict continuous outcomes. If we were to use linear regression on a dataset in Fig. 1 we would not get a model of the data that will allow us to accurately make predictions. Logistic regression uses a logistic function, commonly known as the sigmoid function, to classify data; The sigmoid function better fits binary data.
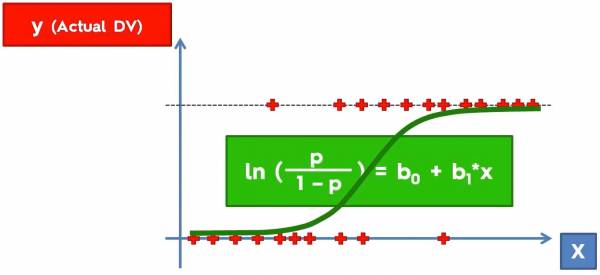 Fig. 1. Plot that shows some data with outputs (0 along the x axis and 1 along the dotted lines) and a sigmoid function in green.
As an example fig. 1 is what actual data would look like; we have the independent variable, x, and the output y. Consider the example below:
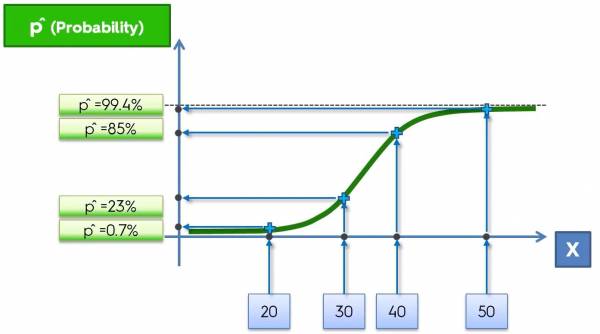 Fig. 2. Plot that imposes the data onto the sigmoid function.
In this example, let's say that we want to classify whether or not a banana is genetically modified based on its length (in mm). So the length of the banana is the independent variable (x) and the classification (GMO or not GMO) is the dependent variable (y). Initially the data would look like Fig. 1, but now we are imposing the data onto the sigmoid function based on their values of x. Mapping the data onto the sigmoid function gives corresponding probabilities for the points and those probabilities are how the machine classifies the data. If the probability is less than 50% then the banana is not GMO and if it is greater than 50% then the banana is GMO.
Here is what the python implementation would look like (Does not include importing the dataset, splitting the dataset, and feature scaling):
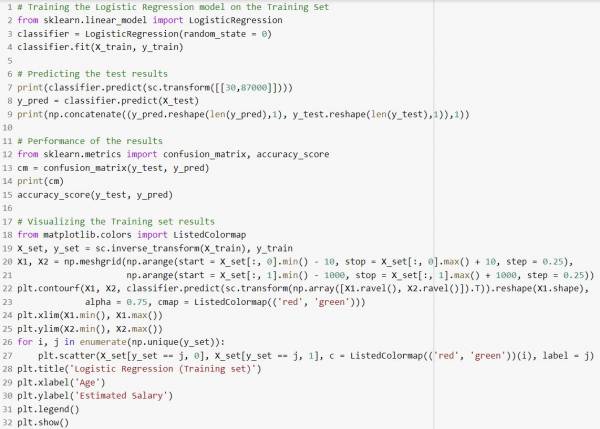 Fig. 3. Python Implementation for classification using logistic regression.
In this example the machine is trying to predict whether or not a person will predict a product based on that person's age and salary.
The accuracy of the given classification implementation in python is 89% and a visualization of the performance of the model is shown below:
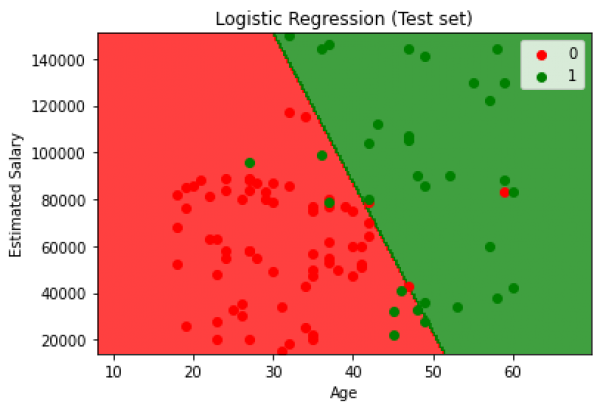 Fig. 4. Visualization of the test results from the classification model where red represents the person not buying the product and green represents the opposite.
K - Nearest Neighbors (K-NN)
K Nearest Neighbors is a classification algorithm that classifies points based on the Euclidean distance. The algorithm looks like this:
- Choose the number, K, of neighbors
- Take the K nearest neighbors of the new data point, according to the Euclidean distance
- Among these K neighbors, count the number of data points in each category
- Assign the new data point to the category where you counted the most neighbors
Looking at an example. Fig. 5 below shows a training set with the red cluster of points being “Category 1” and the green cluster of points being “Category 2”. Let's say we are now trying to determine which category that a new data point belongs to (shown in grey).
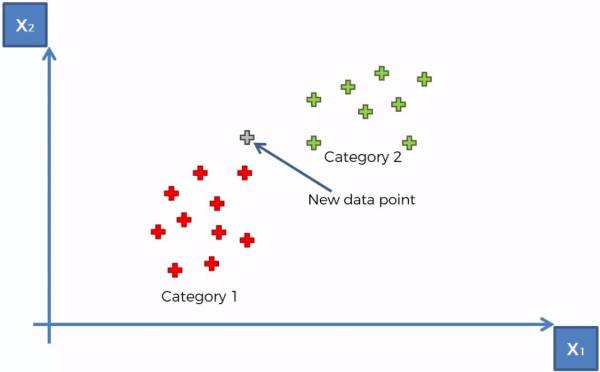 Fig. 5. K-NN example with 2 categories and 1 uncategorized data point.
At this point the K-NN algorithm runs (with K = 5) and the 5 closest points are selected. The category with a larger number of points determines what category that the point belongs to. The 5 closest points are shown in Fig. 6 below and we can conclude that the point belongs to Category 1.
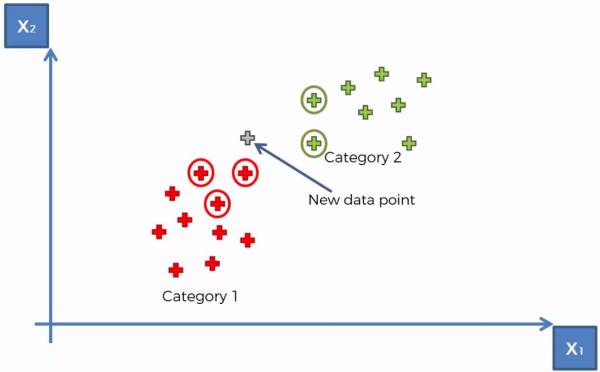 Fig. 6. K-NN example showing K = 5 closest neighbors.
The Python implementation of the K-NN classification method is shown (Does not include importing the dataset, splitting the dataset, and feature scaling):
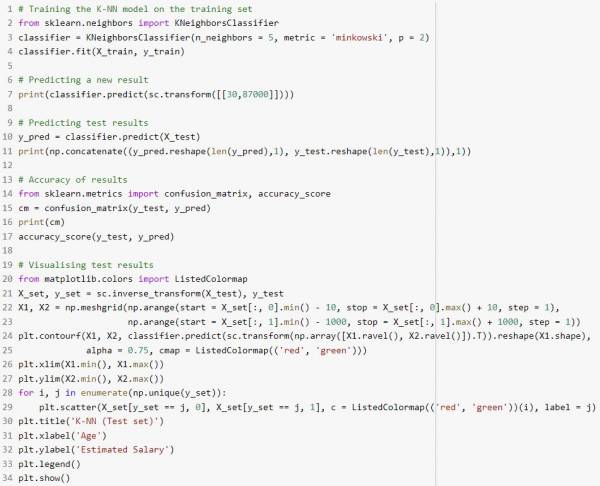 Fig. 7. K-NN Python implementation.
This implementation yields 93% and a visualization of the test results is shown:
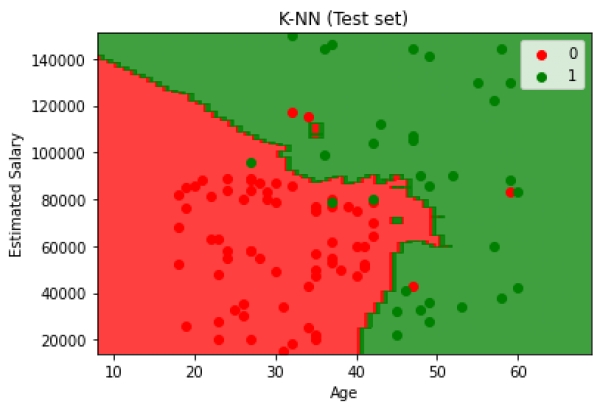 Fig. 8. K-NN Test results.