Dashboard
Visible at http://dashboard.scel-hawaii.org the dashboard provides a means for anyone to access and view the data we are collecting. A module of the Unified Software Team.
Dashboard Repository:
Current Status
- Deployed at http://dashboard.scel-hawaii.org
- Developed with Python Django Web Framework and Semantic UI Front-End Framework
- Connected to Database Module
- Currently using Plotly for Python to generate plots
Future Improvements
- Better handling of data
- Faster load times
- Generating plots on client using JavaScript
- Display data across generations on a single plot
- Allow for comparison of data between boxes
- Current plotting function allows for generating plots with data from multiple boxes
- Collaborate with Forecasting team
- Apply their algorithms to display weather “predictions”
- Implement real-time updating plots
- Improve quality of viewing on mobile devices
Goals (Spring 2017)
- Provide human readable data for the other lab members and general public
- Effectively and accurately display gathered data for each weatherbox generation
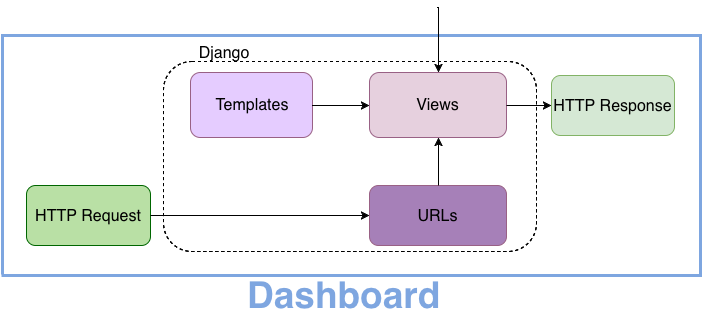
Block Diagram
Dashboard Testing/Development
Working on Dashboard Development WITHOUT Database Connection
- Install Python
- Install pip
- Clone git repository at http://github.com/scel-hawaii/dashboard
- pip install plotly
- pip install numpy
- pip install django
- Verify dashboard is working by running the following command on master branch: python manage.py runserver
- On web browser go to 127.0.0.1:8000 to view the dashboard
- If you don't see it or get an error, something went wrong
- You can also use a virtualenvironment for the Python packages if you wish
Working on Dashboard Development WITH Database Connection
- Launch a virtual machine of your choice (I chose Ubuntu on VirtualBox)
- Follow the instructions for 'Working on Dashboard Development WITHOUT Database Connection' on your virtual machine
- Outside of the dashboard project directory, clone the git repository at http://github.com/scel-hawaii/control_tower
- Run control_tower/sample_data/setup_sample_tables.sh to setup database and tables with sample weatherbox data
- Switch to psql branch of dashboard (in Dashboard project enter command git checkout psql)
- Run dashboard with following command: python manage.py runserver
- Should generate graphs with database data instead of csv
Dashboard Deployment
Deploying the Dashboard on Server
Follow the following steps to for deploying the dashboard on a server
- Install and Configure VirtualEnv and VirtualEnvWrapper
- sudo apt-get install python-pip (skip this if pip already installed)
- sudo pip install virtualenv virtualenvwrapper
- echo “export WORKON_HOME=~/Env” » ~/.bashrc
- echo “source /usr/local/bin/virtualenvwrapper.sh” » ~/.bashrc
- source ~/.bashrc
- Setup Dashboard Django Project
- sudo apt-get install git (skip this if git already installed)
- cd ~
- mkvirtualenv dashboard
- git clone http://github.com/scel-hawaii/dashboard (provide credentials to access private dashboard repo)
- cd Dashboard/Dashboard
- pip install django psycopg2 plotly numpy
- python manage.py collectstatic
- test django app working properly with: python manage.py runserver 127.0.0.1:8080
- exit virtualenv with: deactivate
- Setup uWSGI Application Server
- sudo apt-get install python-dev
- sudo pip install uwsgi
- quickly test uWSGI with: uwsgi –http :8080 –home /home/user/Env/dashboard –chdir /home/user/dashboard/dashboard -w dashboard.wsgi (in the currently deployed dashboard, user is replaced with control_tower)
- sudo mkdir -p /etc/uwsgi/sites
- cd /etc/uwsgi/sites
- create file called dashboard.ini with your favorite editor (ex: vim) and insert the following contents:
[uwsgi]
project = dashboard
base = /home/**user**

chdir = %(base)/%(project)/%(project)
home = %(base)/Env/%(project)
module = %(project).wsgi:application

master = true
processes = 5

socket = %(base)/%(project)/%(project)/%(project).sock
chmod-socket = 666
vacuum = true
- create file at /etc/systemd/system/uwsgi.service with editor (ex: vi /etc/systemd/system/uwsgi.service) and insert the following contents:
[Unit]
Description=uWSGI Emperor service
After=syslog.target

[Service]
ExecStart=/usr/local/bin/uwsgi --emperor /etc/uwsgi/sites
Restart=always
KillSignal=SIGQUIT
Type=notify
StandardError=syslog
NotifyAccess=all

[Install]
WantedBy=multi-user.targetr.target
- sudo systemctl daemon-reload
- Configure Nginx
- create file at /etc/nginx/sites-available/dashboard with your favorite editor (ex: vi /etc/nginx/sites-available/dashboard) and insert the following contents:
server { listen 80; server_name dashboard.scel-hawaii.org www.dashboard.scel-hawaii.org; location = /favicon.ico { access_log off; log_not_found off; } location /static/ { root /home/**user**/dashboard/dashboard; } location / { include uwsgi_params; uwsgi_pass unix:/home/**user**/dashboard/dashboard/dashboard.sock; } } - sudo ln -s /etc/nginx/sites-available/dashboard /etc/nginx/sites-enabled
- Check syntax with: sudo service nginx configtest (if errors exist, fix before proceeding)
- sudo service nginx restart
- sudo systemctl start uwsgi
- To start uWSGI on reboot: sudo systemctl enable uwsgi
- Resources used:
Problems/Resolutions
- Noticeable load time of plots causing entire page to hang
- Utilize separate process to handle plot generation
- Load the plots with HTTP Request to specific url
Authors
Contributing authors:
Created by tbyers on 2017/05/01 07:04.
