Graph Library Design Doc
Motivation
The motivation for the graph library design doc is to pinpoint which mapping package and api is best to use for our dashboard. For this particular implementation, we want to be able to display location of future weather boxes alongside with any heat map markers of status of weather boxes or any other data.
Graphing Options
There are many different graphing library or nonlibraries that we could have chosen to implement our graphing modules. Some of the options that we chose are the following.
- Pure D3.js
- Charts.js
- Recharts (React Components for D3.js)
D3.js
D3.js already exists for javascript applications; however, we would need to implement our own classes to access the line graph components. Since no one had experience with graphing libraries on our team we decided to go not go with D3.js. This might reduce some overhead in the future if we go with d3.js and create our own library; however, for now we opted out.
Charts.js
Didn't look as crisp and sharp as recharts. Also wanted to use framework that revolved around D3
Recharts
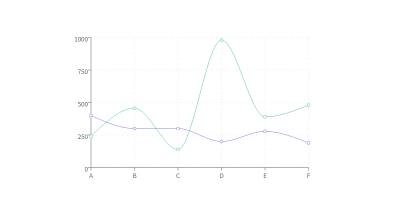
Open source framework for implementing D3 as react components. This seemed like the best option because the ramp up time for implementing the component was small and we were able to get a functional product working quickly. Read more on the API here recharts API.
Authors
Contributing authors:
Created by kcho on 2018/02/08 08:44.

