Landing Page Design Doc
This page references the design doc for the landing page of dashboard v2. We will discuss the design of the dashboard landing page.
Motivation
This will be the main page that all people going to the dashboard will see. Since we want to primarily show users as much data as possible, we want to present multiple sets of data on the home page. The data should be implemented with pleasing data graphs and query as quickly as possible.
Design Considerations
We want to consider what a new user and a frequent visitor would want to see when going to the landing page. This may consist of average solar irradiation data, battery life of each box, or checking for down boxes. By quickly displaying this data we are able to provide valuable information to our team members. Ideally the application will be designed for mobile-responsive applications.
Sketch

Electronic Version
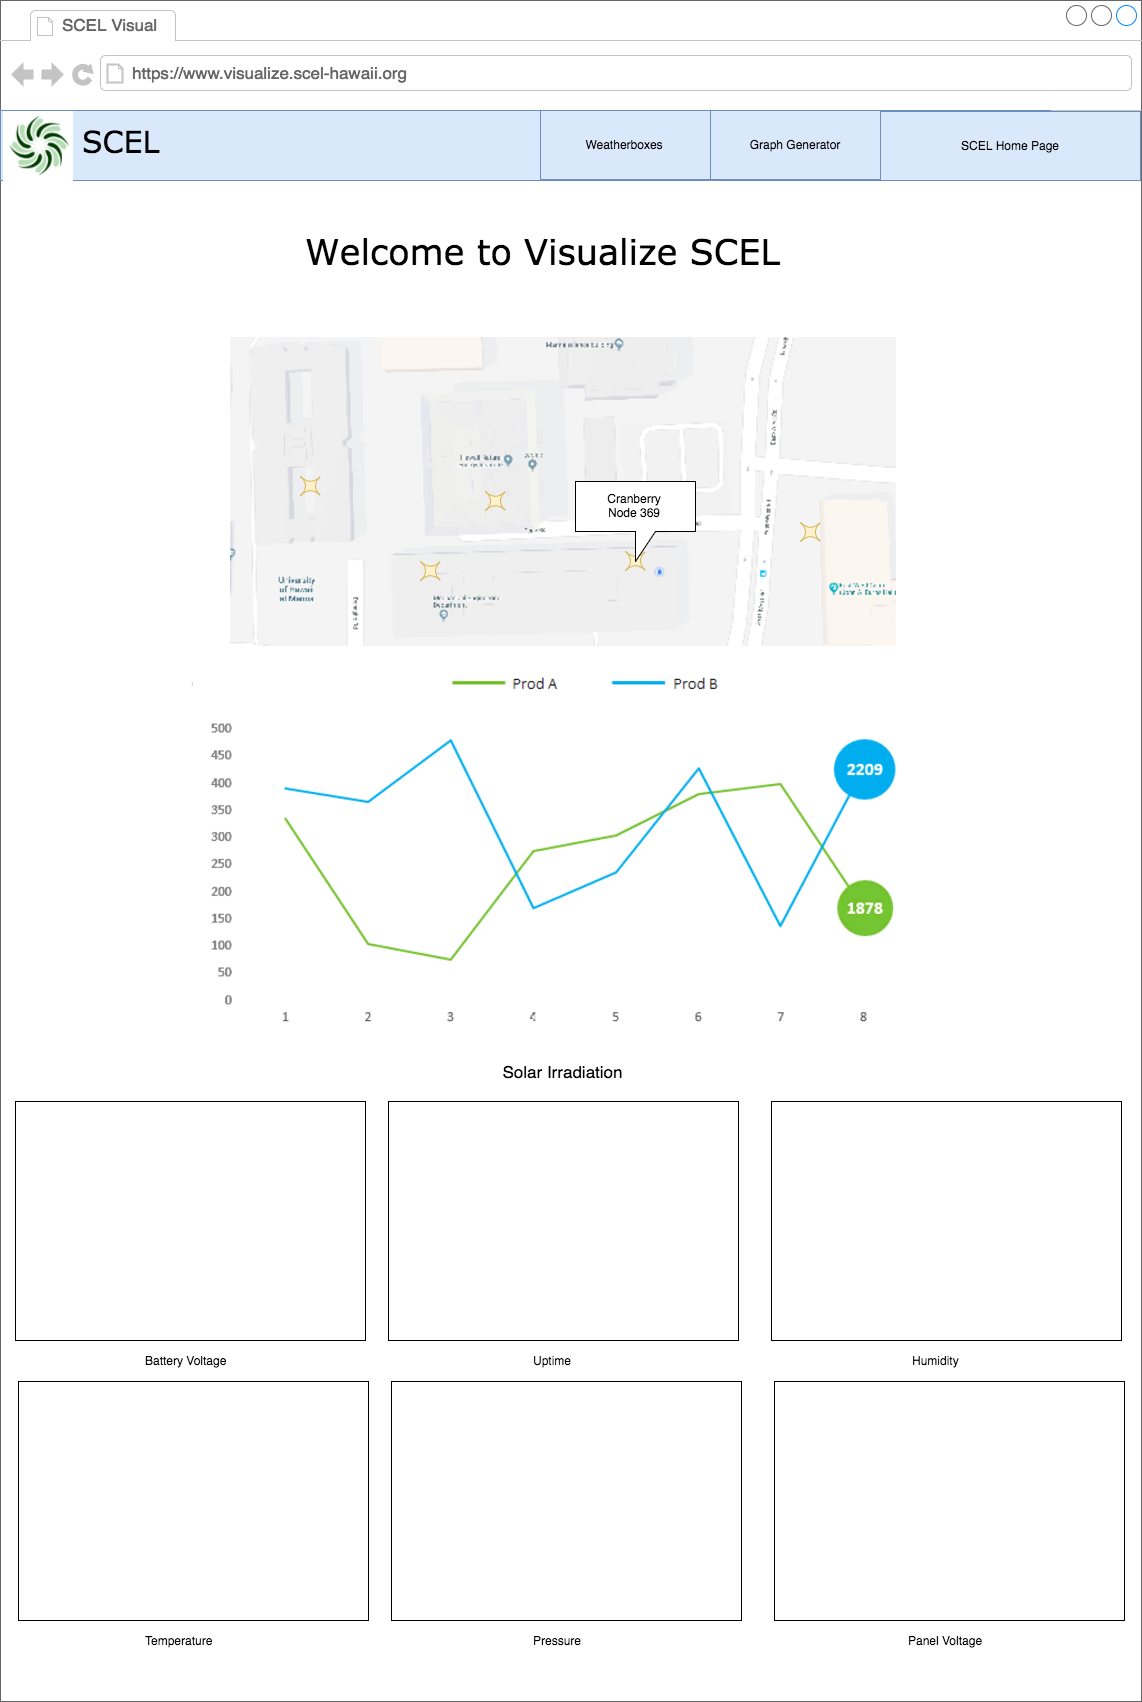
The design of the landing page will consist of displaying data from each generation of weatherbox. This will be the main source of data visualization for the dashboard where users are provided with streamed information.
Technologies involved in the landing page
Some of technologies involved in the landing page that we will have to learn involve the following.
Additional Features
Some additional features that can be considered is to put a quick diagnostic section that shows the status of each box in the lab. This can be as simple as a traffic light configuration where each box can be symbolized with a red (down), yellow (issues), green (okay) diagnostic light.
Authors
Contributing authors:
Created by kcho on 2018/01/23 09:31.