Weatherboxes Page Design Doc
This page references the design doc for the weatherboxes page of dashboard v2. We will discuss the design of the dashboard weatherboxes page.
Motivation
This is the page where users can view a weahterbox's data based on what weatherbox and node they choose. The following data were collected by each weatherbox and will be displayed into line graphs: solar irradiance, pressure, temperature, humidity, uptime, battery voltage, and panel voltage.
Weatherboxes Page Block Diagram
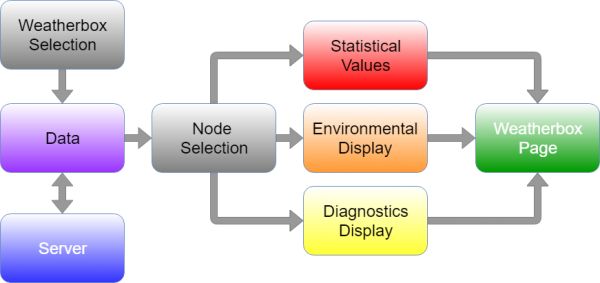
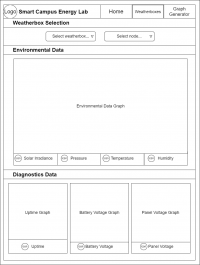
The users will select a weatherbox from the weatherbox selection module which prompts the server for the data. The user then selects the node(s) they want to be displayed up on the statistical values, environmental display, and diagnostics display modules. The weatherbox page encompasses all four modules mentioned.
Design Considerations
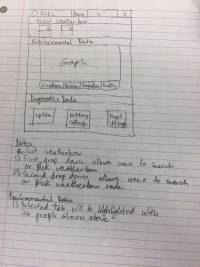
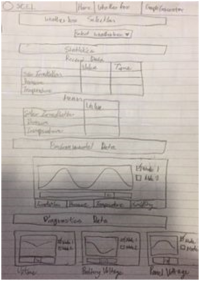
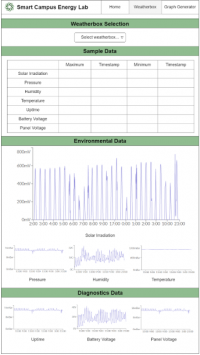
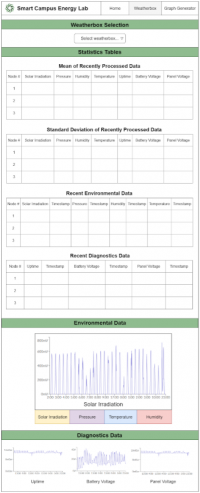
We want to consider the page to be user friendly while being able to see all collected data listed above. This includes the ease of being able to select a specific weatherbox and its corresponding nodes from a drop down menu. The organization of the page will allow users to see tables for statistical values and both environmental and diagnostics data where specific environmental data can be seen by switching a tab.
Mockups
Electronic Copies
Technologies involved in the weatherboxes page
There are no technologies involved with the current design of the weatherboxes page.
Additional Features
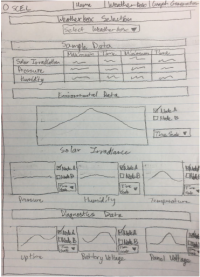
Additional features in consideration include displaying environmental data side by side like how the diagnostics data was laid out and a description of the selected weatherbox for users not related with the lab.
Evaluation of Design
While making the Preliminary Design Review (PDR) Presentation, new considerations were made for ease of access to information for a weatherbox. The following design choices will be considered:
- Rather than displaying only one environmental data graph at a time, just display all.
- Allow for simultaneous display of node trends (i.e. Apple Node 1 alongside Apple Node 4) for comparison.
After the PDR, feedback was given on the design choices as well as additional features to consider. The following features were suggested during the presentation:
- Being able to choose a specific time scale (i.e. selecting only one day, one week, one month, one year, all historical, etc).
- Not only display the graphs, but provide some other useful information for the graphs.
After CDR, feedback was given on features on the weatherboxes page. The following were discussed in the presentation:
- Retain changing button display for environmental display
- Consider other statistical values to display rather than maxima and minima (e.g. mean and standard deviation) for data anaylsis
Issues and Set Backs
The weatherbox page was set back in terms of progress due to personal and server issues. Currently, the implementation of the weatherbox page uses one set of data from the National Renewable Energy Laboratory (NREL) for testing as server was not able to store collected data from deployed weatherboxes. Due to this, the following features are have not been fully implemented:
- Weatherbox selection
- Node selection
- Statistical values
For new members, please go through the freeCodeCamp and React tutorials and exercises as the features on the weatherbox page requires you to understand object oriented programming languages, specifically ES6. Notable features:
- Changing environmental display with buttons
- State changes with button handlers
- Weatherbox selection
- Handling of data being displayed
- Statistical values
- Data retrieval and manipulating them for calculated values
Future Implementation
As of Wednesday February 28, 2018
The following features will be implemented for the Weatherboxes Page:
- Date selection and time scaling
- Separated environmental graphs
- Simultaneous graphing of nodes
- Useful data values from graphs
As of Wednesday May 11, 2018
The following features will be implemented in the future:
- Node selection
- Weatherbox selection
- Compact statistical tables
Authors
Contributing authors:
Created by kcho on 2018/01/23 09:32.
