This is an old revision of the document!
Dashboard
Visible at http://dashboard.scel-hawaii.org the dashboard provides a means for anyone to access and view the data we are collecting. A module of the Unified Software Team.
Dashboard Repository:
Current Status
- Deployed at http://dashboard.scel-hawaii.org
- Developed with Python Django Web Framework and Semantic UI Front-End Framework
- Connected to Database Module
- Currently using Plotly for Python to generate plots
Future Improvements
- Better handling of data
- Faster load times
- Generating plots on client using JavaScript
- Display data across generations on a single plot
- Allow for comparison of data between boxes
- Current plotting function allows for generating plots with data from multiple boxes
- Collaborate with Forecasting team
- Apply their algorithms to display weather “predictions”
- Implement real-time updating plots
- Improve quality of viewing on mobile devices
Goals (Spring 2017)
- Provide human readable data for the other lab members and general public
- Effectively and accurately display gathered data for each weatherbox generation
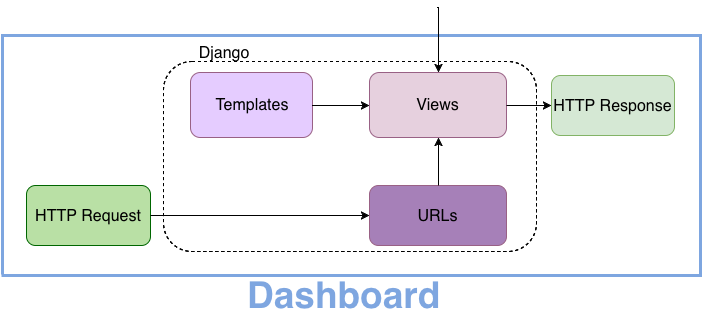
Block Diagram
Dashboard Testing/Development
Testing Dashboard with Database Connection
- Instructions for testing the Dashboard on a VM with database
Dashboard Deployment
Deploying the Dashboard on Server
- Instructions for deploying the Dashboard
Problems/Resolutions
- Noticeable load time of plots causing entire page to hang
- Utilize separate process to handle plot generation
- Load the plots with HTTP Request to specific url
